
Written By: |
Grace Orende |
|---|---|
Availability Management
The Availability Management Dashboard provides customers with real-time visibility into environmental conditions—specifically temperature—across their distributed sites. This dashboard enables proactive monitoring by identifying which locations are operating within normal thermal ranges and which are exceeding safe thresholds, helping prevent hardware failures due to overheating. By consolidating key environmental indicators into a single view, this dashboard empowers you to reduce equipment risk, ensure compliance with facility standards, and maintain uninterrupted system availability through proactive asset monitoring.
Availability Management Dashboard
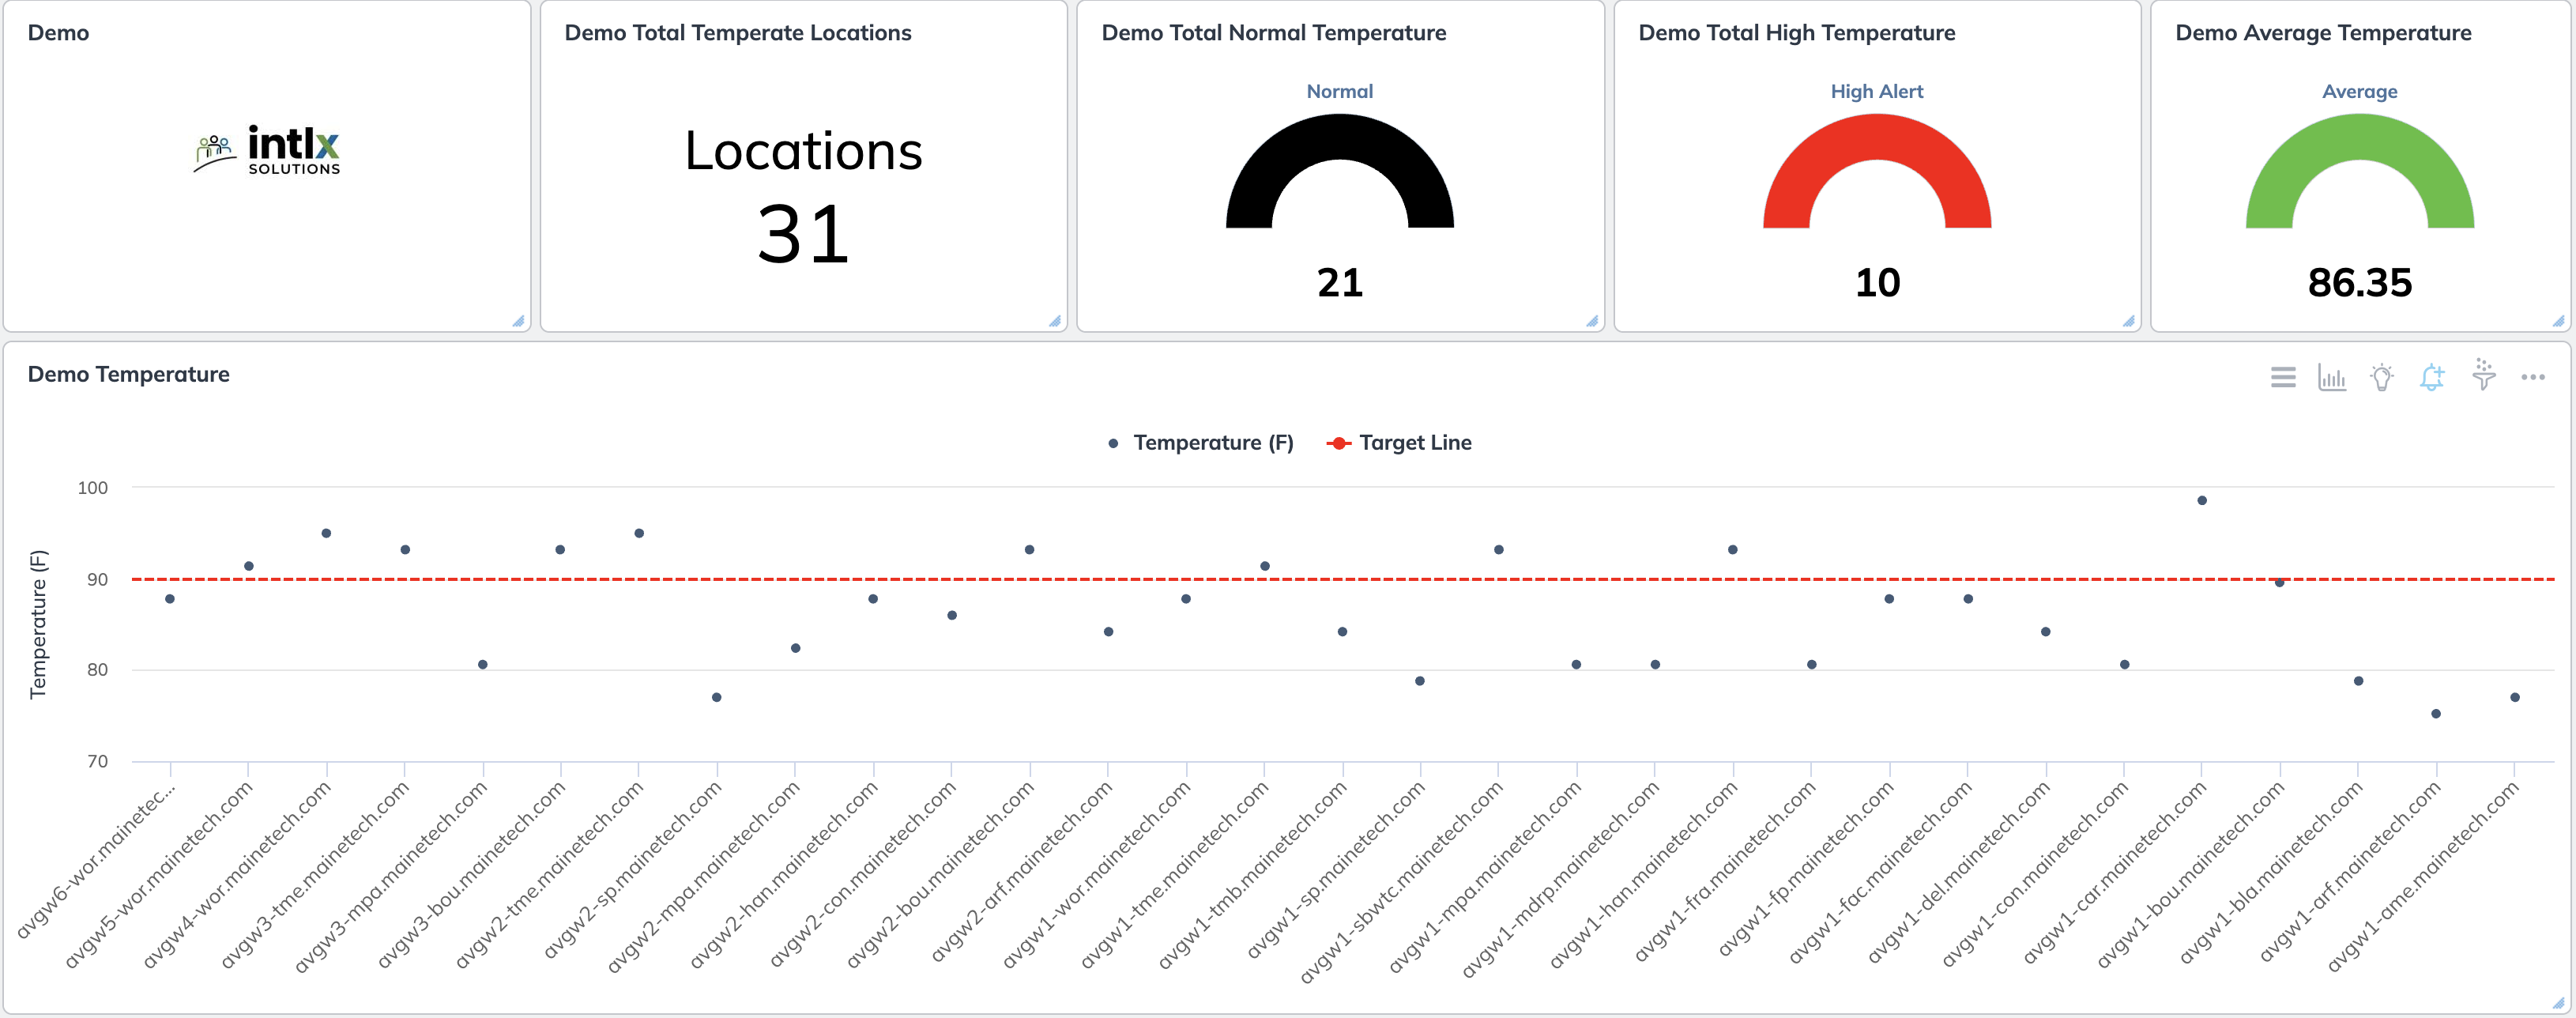
1. Total Locations
This KPI displays the number of monitored sites across the organization. It helps to assess the scope of their environmental monitoring and ensure all critical areas are covered.
3. Total Normal Temperature
This gauge shows how many locations are operating within acceptable temperature ranges. It gives reassurance that most systems are performing within healthy limits, reducing the risk of temperature-related issues.
4. Total High Temperature
This panel highlights the number of sites where temperatures have exceeded recommended thresholds. It enables customers to quickly identify potential problem areas that may require urgent cooling or investigation.
5. Average Temperature
This metric provides an overview of the average environmental temperature across all monitored locations. It offers a helpful baseline for assessing the overall thermal condition of the infrastructure.
6. Temperature (Scatter Plot)
This chart plots individual temperature readings across different locations against a defined threshold. It adds value by allowing customers to visually pinpoint outliers and take location-specific action before system performance is affected.
7. Demo Temperature Summary
This table provides a detailed log of all temperature, including date, customer, asset name, and IP address. It gives a clear, line-by-line view of all alert activity, enabling deeper investigation, quick identification of affected systems, and documentation for audit or compliance needs.